K-Nearest Neighbors (KNN) is a supervised machine learning algorithm. It is very interpretable and straightforward. The most common use case of KNN is for classification problems (It can be used to solve regression problems though). To predict the class of a new data point, it considers the classes of its “K” number of nearest data points and chooses the class in which most of the nearest data points belong as the predicted class.
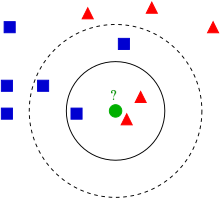
As the picture depicted, the predicted outcome will depend on the choice of “K”. If we want to classify a test sample given (the green dot), selecting a K=3 will give us a prediction of a red triangle, as there are 2 red triangles and only 1 square as its nearest neighbours. Selecting K=5 on the other hand will predict it as a blue square, because there are 3 blue squares versus 2 red triangles as its nearest neighbors.
The assumption behind K-Nearest Neighbors is that similar cases with the same class label are near each other. The distance between cases gives a sense of their dissimilarity.
The procedure of performing K-Nearest Neighbors:
- Choose a value for K, which can be any positive integer.
- Calculate the distance of the unknown case from other cases.
- Select the K-observations in the training data that are “nearest” to the unknown data point.
- Predict the response of the unknown data point by taking a majority vote from the K-nearest neighbors.
How to calculate the distance (a measure of dissimilarity)?
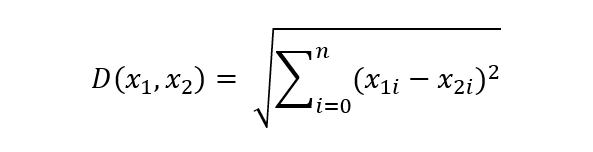
Generally, we use the Euclidean distance as the standard method to gauge the dissimilarity among data points. The equation of Euclidean distance is as follows:
Since KNN is dependent on the distance computation to classify the target data, and the distance between data is dependent on the coordinate values of the data points associated. The scaling of data will have a dramatic effect on the result.
How to choose K?
The main drawback of KNN is that it is susceptible to local structure of data. The choice of K will highly affect the algorithm outcome. K is called the hyperparameter. The way of finding the best K is more of a heuristic process.
A low value of K would be vulnerable to overfitting, as the model may be too complex and end up capturing noise. However, a high value of K would easily end up underfitting (over-generalization) and result in a simple model which is unable to capture the underlying patterns in the data. Consider two extreme cases with K=1 and K=n (n is the size of the sample). If K is set to 1, which means the model captures every data it sees in training and will certainly overfit. If K is set to n, it considers the whole dataset and predicts an unknown as the mode of this dataset, the result will be too general to consider useful.
One solution is to reserve a part of the data to validate the model’s accuracy. Starting from K=1, use the training part for modeling, and calculate the accuracy of prediction by using the validation set. Repeat this process while increasing the K, and see which K is the best choice for our model.
We can calculate the validation accuracy of different Ks for our model by plotting the accuracy against the number of K.
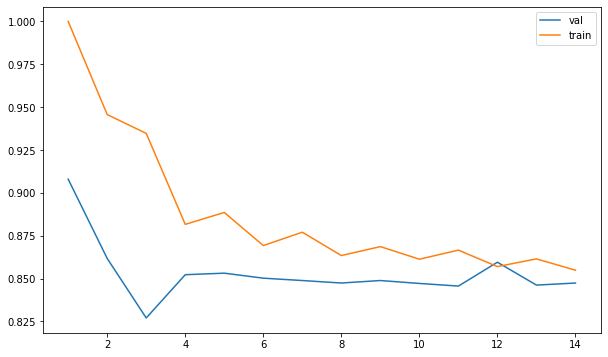
The plot gives us an intuitive approach in understanding how the accuracy of our model varies with the choice of K. Another method to fine tune the hyperparameter K is through using the GridSearchCV.
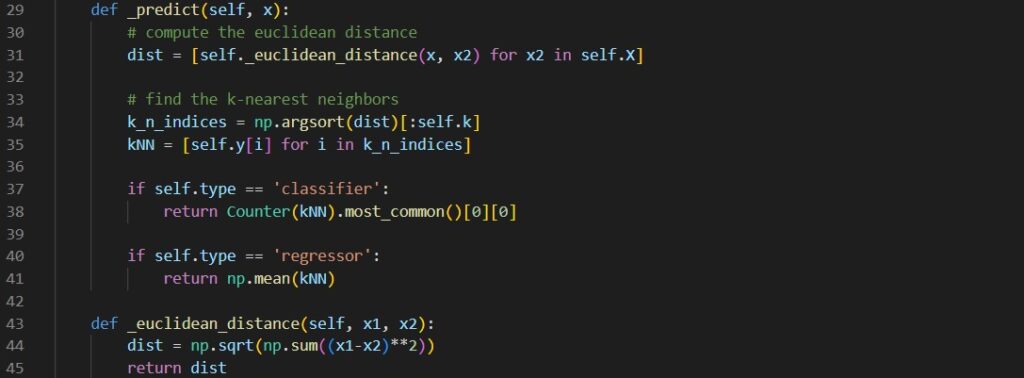
Python Implementation
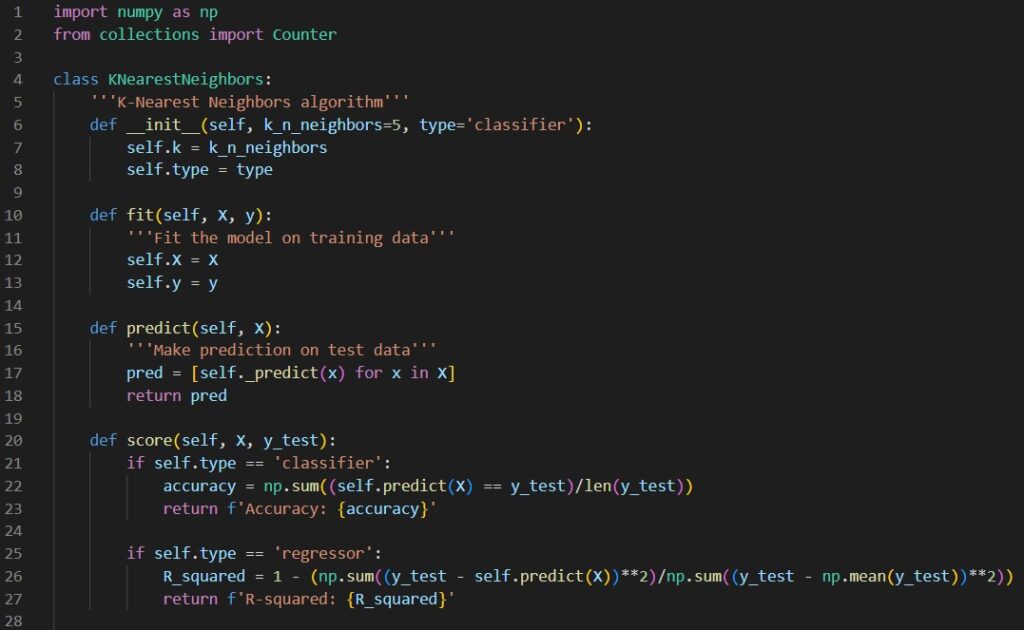
One can use KNN directly with the help of scikit-learn library, or we can implement it ourselves. The following code snippets are the general implementation of KNN classifier and regressor in Python.
I have done a project about drug classification using a Kaggle dataset to demonstrate the idea of k-Nearest Neighbors. This project can be found on my GitHub. Feel free to take a look in case you feel interested.
Reference
Wikipedia. (2023, March 31). K-nearest neighbors algorithm. Wikipedia. Retrieved April 5, 2023, from https://en.wikipedia.org/wiki/K-nearest_neighbors_algorithm